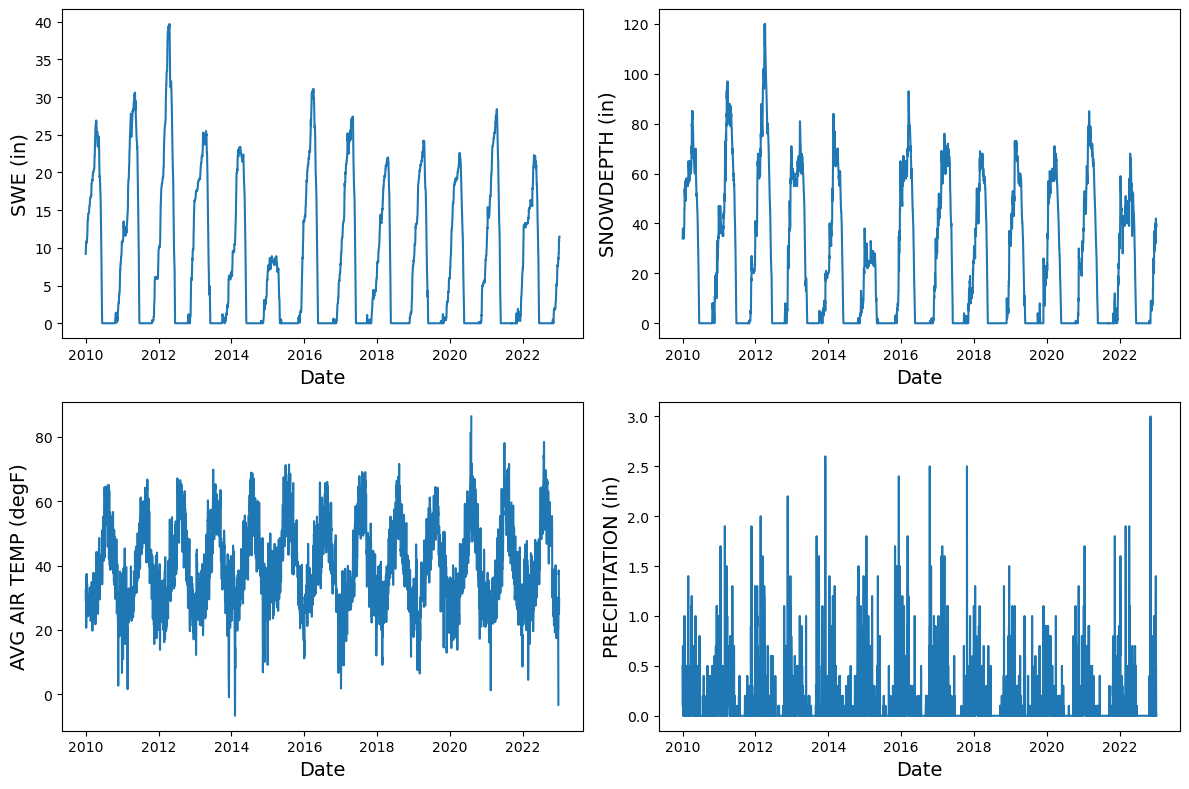
Data Download and Cleaning#
We will download SNOTEL data set using the metloom.
Download Data#
%pip install -q metloom
Note: you may need to restart the kernel to use updated packages.
from datetime import datetime
from metloom.pointdata import SnotelPointData

ALLOWED_VARIABLES = [
    SnotelPointData.ALLOWED_VARIABLES.SWE,
    SnotelPointData.ALLOWED_VARIABLES.TEMPAVG,
    SnotelPointData.ALLOWED_VARIABLES.SNOWDEPTH,
    SnotelPointData.ALLOWED_VARIABLES.PRECIPITATION,
]

# You can get triplets from: https://wcc.sc.egov.usda.gov/nwcc/yearcount?network=sntl&state=&counttype=statelist

snotel_point = SnotelPointData(station_id="502:WA:SNTL", name="Green Lake")
data = snotel_point.get_daily_data(
                start_date=datetime(*(2010, 1, 1)),
                end_date=datetime(*(2023, 1, 1)),
                variables=ALLOWED_VARIABLES,
            )

data.info()
data.head()
<class 'geopandas.geodataframe.GeoDataFrame'>
MultiIndex: 4749 entries, (Timestamp('2010-01-01 08:00:00+0000', tz='UTC'), '502:WA:SNTL') to (Timestamp('2023-01-01 08:00:00+0000', tz='UTC'), '502:WA:SNTL')
Data columns (total 10 columns):
 #   Column               Non-Null Count  Dtype
---  ------               --------------  -----
 0   geometry             4749 non-null   geometry
 1   SWE                  4748 non-null   float64
 2   SWE_units            4748 non-null   object
 3   AVG AIR TEMP         4738 non-null   float64
 4   AVG AIR TEMP_units   4738 non-null   object
 5   SNOWDEPTH            4748 non-null   float64
 6   SNOWDEPTH_units      4748 non-null   object
 7   PRECIPITATION        4745 non-null   float64
 8   PRECIPITATION_units  4745 non-null   object
 9   datasource           4749 non-null   object
dtypes: float64(4), geometry(1), object(5)
memory usage: 551.3+ KB
| geometry | SWE | SWE_units | AVG AIR TEMP | AVG AIR TEMP_units | SNOWDEPTH | SNOWDEPTH_units | PRECIPITATION | PRECIPITATION_units | datasource | ||
|---|---|---|---|---|---|---|---|---|---|---|---|
| datetime | site | ||||||||||
| 2010-01-01 08:00:00+00:00 | 502:WA:SNTL | POINT Z (-121.17093 46.54741 5920.00000) | 9.2 | in | 32.18 | degF | 34.0 | in | 0.5 | in | NRCS |
| 2010-01-02 08:00:00+00:00 | 502:WA:SNTL | POINT Z (-121.17093 46.54741 5920.00000) | 9.7 | in | 29.30 | degF | 37.0 | in | 0.3 | in | NRCS |
| 2010-01-03 08:00:00+00:00 | 502:WA:SNTL | POINT Z (-121.17093 46.54741 5920.00000) | 10.0 | in | 28.94 | degF | 38.0 | in | 0.1 | in | NRCS |
| 2010-01-04 08:00:00+00:00 | 502:WA:SNTL | POINT Z (-121.17093 46.54741 5920.00000) | 10.1 | in | 33.80 | degF | 38.0 | in | 0.7 | in | NRCS |
| 2010-01-05 08:00:00+00:00 | 502:WA:SNTL | POINT Z (-121.17093 46.54741 5920.00000) | 10.8 | in | 36.86 | degF | 38.0 | in | 0.1 | in | NRCS |
import numpy as np
import pandas as pd
import matplotlib.pyplot as plt

for_plotting=data.reset_index()

units={
    "SWE": "in",
    "SNOWDEPTH": "in",
    "AVG AIR TEMP": "degF",
    "PRECIPITATION": "in"
}

variables_to_plot = [
    "SWE", "SNOWDEPTH", "AVG AIR TEMP", "PRECIPITATION"
]

plt.figure(figsize=(12, 8))

for variable in variables_to_plot:
    plt.subplot(2, 2, variables_to_plot.index(variable) + 1)
    plt.plot(for_plotting["datetime"], for_plotting[variable], label=variable)
    plt.ylabel(f"{variable} ({units[variable]})", fontsize=14)
    plt.xlabel("Date", fontsize=14)

plt.tight_layout()
plt.show()

for_plotting.isnull().sum() # Check for missing values
datetime                0
site                    0
geometry                0
SWE                     1
SWE_units               1
AVG AIR TEMP           11
AVG AIR TEMP_units     11
SNOWDEPTH               1
SNOWDEPTH_units         1
PRECIPITATION           4
PRECIPITATION_units     4
datasource              0
dtype: int64
Some Background#
At a given point, snow depth (\(h_s\)) is related to Snow Water Equivalent (SWE) by the local bulk density (\(\rho_b\)):
\[
\text{SWE} = h_s \frac{\rho_b}{\rho_w}
\]
where depth is measured in centimeters, density in grams per centimeters cubed, \(\rho_w\) is the density of water (1 g cm \(^{-3}\)), and SWE is measured in centimeters of water. As such,
\[
\text{SWE} = h_s \times \frac{\rho_b}{1}
\]
\[
\rho_b = \frac{\text{SWE}}{h_s}
\]
clean_df=(
    for_plotting
    .assign(
        swe=lambda x: x.SWE.map(lambda y: y*2.54 if y is not None else None),
        snowdepth=lambda x: x.SNOWDEPTH.map(lambda y: y*2.54 if y is not None else None),
        precipitation=lambda x: x.PRECIPITATION.map(lambda y: y*2.54 if y is not None else None),
        tempavg=lambda x: x['AVG AIR TEMP'].map(lambda y: (y-32)*5/9 if y is not None else None)
    )
    .set_index('datetime')
    .assign(
        precip_7_days_avg=lambda x: x.precipitation.shift().rolling(window="7D", min_periods=7).mean(),
        tempavg_7_days_avg=lambda x: x.tempavg.shift().rolling(window="7D", min_periods=7).mean(),
    )
    .filter(["datetime", "swe", "snowdepth", "tempavg_7_days_avg", "precip_7_days_avg"])
    .dropna()
    .query(
        "snowdepth != 0 and swe != 0 and "
        "snowdepth > 5 and swe > 3"
    )
    .assign(snowdensity=lambda x: x.swe / x.snowdepth)
)

clean_df.head()
| swe | snowdepth | tempavg_7_days_avg | precip_7_days_avg | snowdensity | |
|---|---|---|---|---|---|
| datetime | |||||
| 2010-01-08 08:00:00+00:00 | 27.178 | 91.44 | -1.414286 | 0.653143 | 0.297222 |
| 2010-01-09 08:00:00+00:00 | 27.686 | 91.44 | -1.528571 | 0.544286 | 0.302778 |
| 2010-01-10 08:00:00+00:00 | 27.686 | 91.44 | -0.971429 | 0.435429 | 0.302778 |
| 2010-01-11 08:00:00+00:00 | 27.686 | 88.90 | -0.557143 | 0.399143 | 0.311429 |
| 2010-01-12 08:00:00+00:00 | 27.686 | 88.90 | -0.271429 | 0.181429 | 0.311429 |
# let's store data for later use

import os

os.makedirs("data", exist_ok=True)
clean_df.to_csv("data/clean_data.csv", index=False)

