Data Descriptions#
(10 minutes)
Campaigns are participant driven and produce community wide data. Without our vast community, we wouldn’t have the robust ground-based observations that are part of the SnowEx collection. Discover the ground-based calibration and validation measurements central to the SnowEx field campaigns. Collecting in situ measurements require hours of manual labor and attention to detail. While observers adhere to standard protocols, they often rely on their best judgment and collective expertise when facing challenging sampling conditions.
Learning Objectives
Become familiar with measurements available for calibration/validation
Know the sampling strategy and naming conventions behind the campaign design
Learn where to find and search for SnowEx data
Ground Observations#
What ground-based data sets are central for snow field campaigns?#
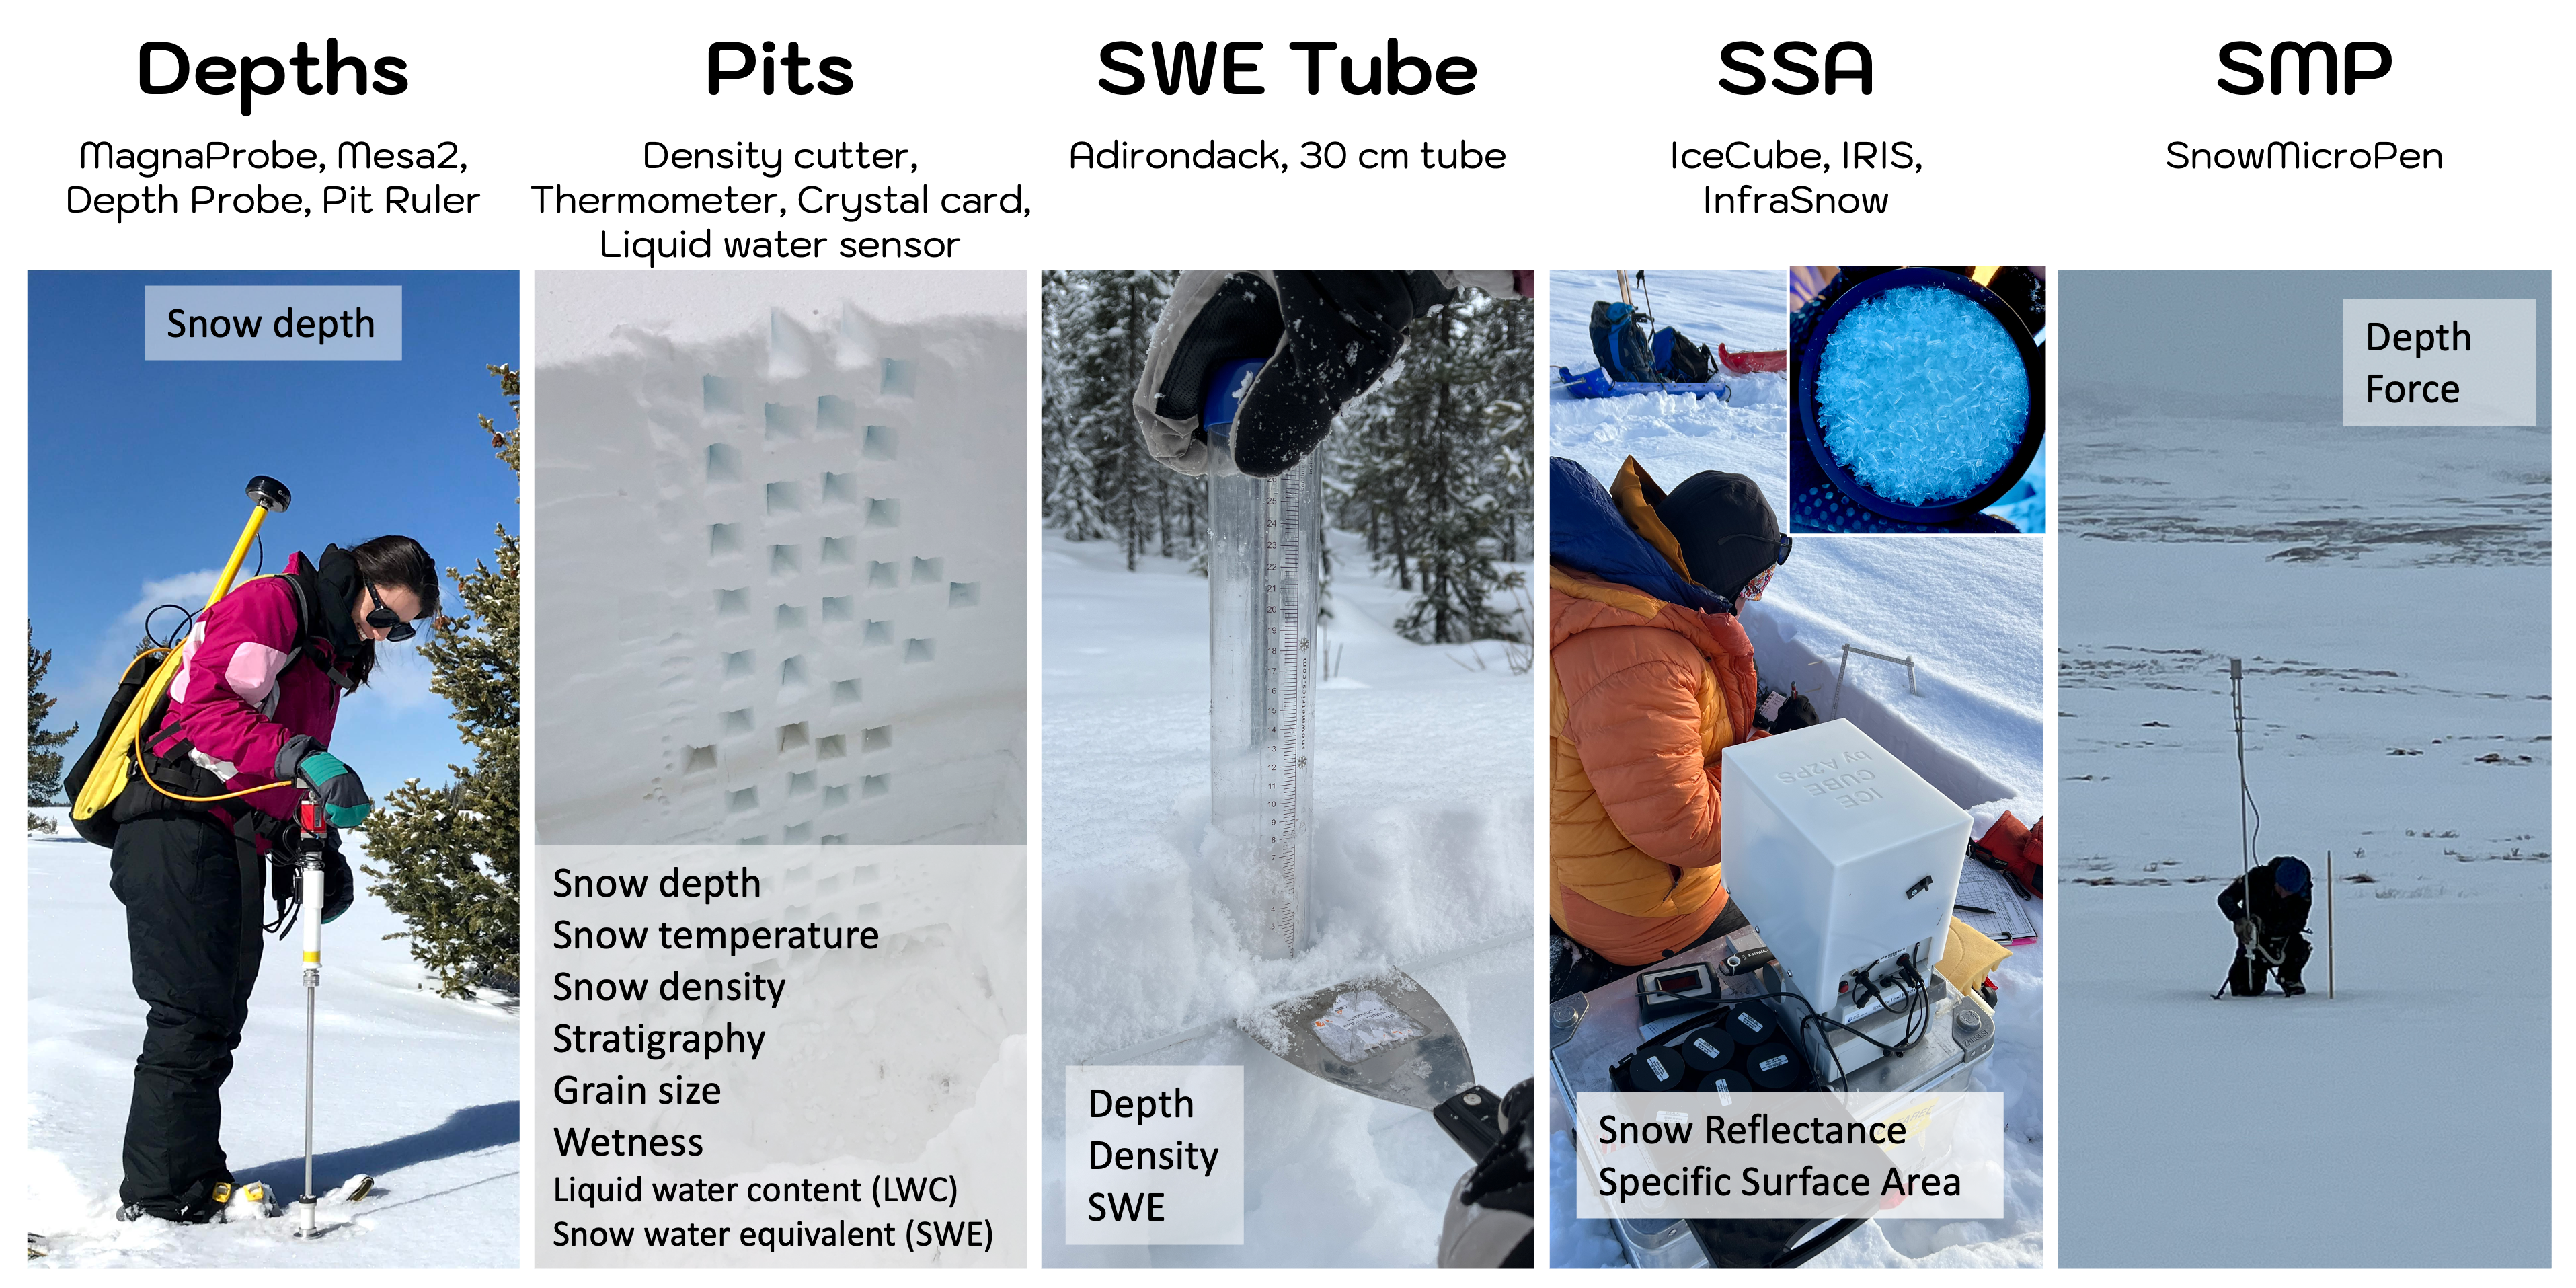 Figure 1. Ground-based measurements central to the SnowEx campaigns. (Left to Right panels) 1). Depth Transects: Observer uses the MagnaProbe to measure snow depths.
2). Snow Pit: Vertical density cuts show the dual profile sampling protocol. 3). Interval Board/SWE Tube: Overnight snow being measured in a snow tube to record the daily change during the IOP campaign. 4). Specific Surface Area (SSA) being collected at a shallow tundra snow pit with the IceCube. 5). SnowMicroPen (SMP) penatrating the snowpack to record snow stratigraphy over a range of intervals (10-50m) away from the centralized snow pit.
Additional detail on depth transects and snow pit sampling procedures#
Depth Transects
Here you can see a summary of some of the depth sampling patterns you might discover in the snow depth data sets. Typically the pattern is a result of what instrument collection technique is deployed.
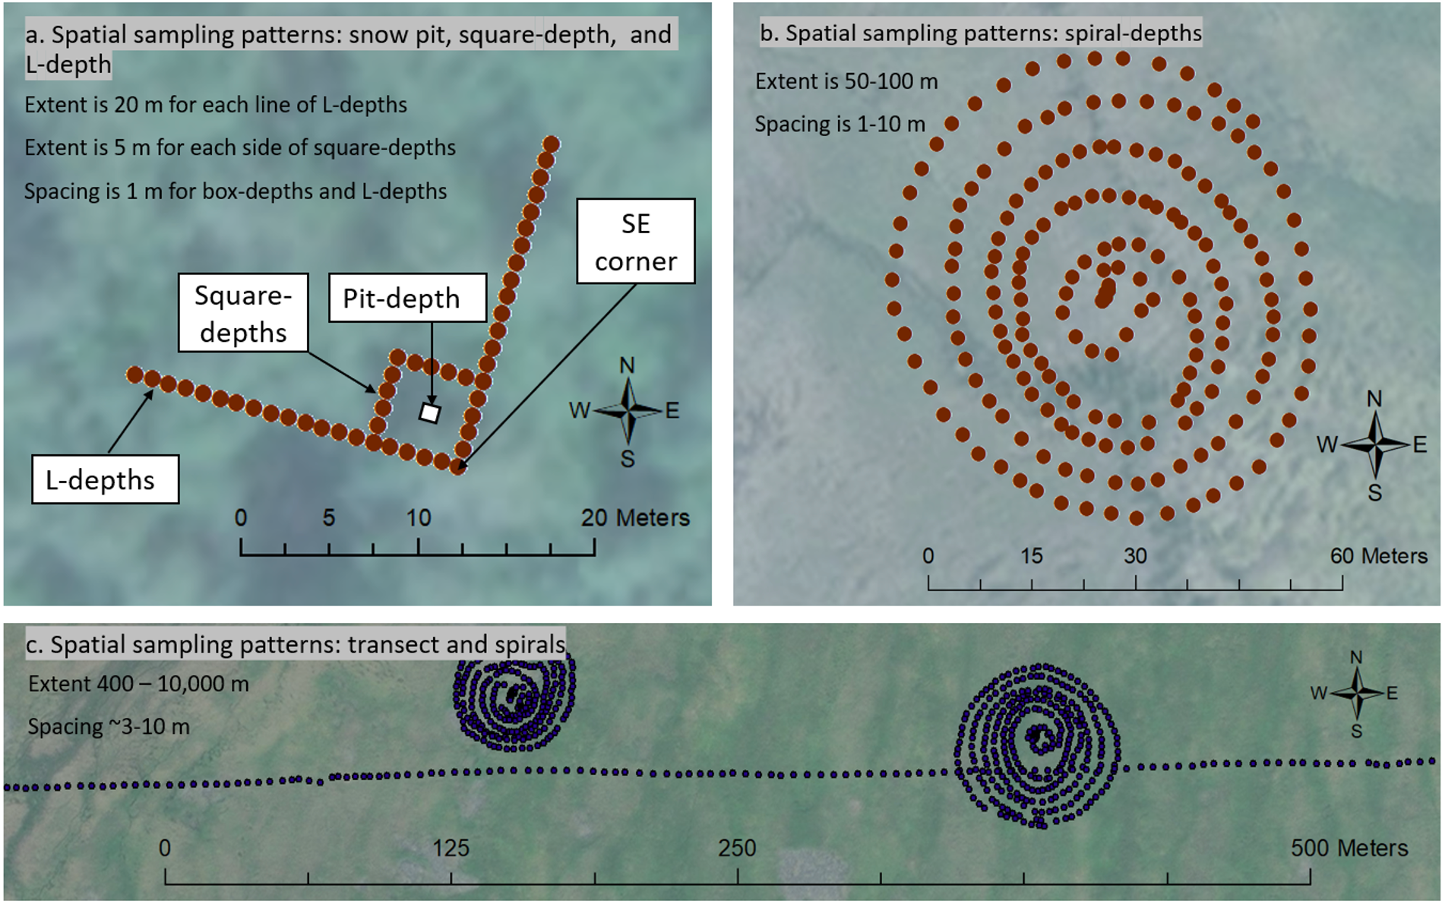
Figure 2. Examples of snow depth measurements taken in different spatial patterns, representing different spatial extents. a). shows pit-depth, square-depths with L-depths from a study plot. b). captures spiral-depths collected using a MagnaProbe. c). Includes spiral-depths and a single transect, ~10km in total length. Note the difference in scale across each panel. Background images are courtesy of @ 2020 Maxar Technologies Inc., Alaska Geospatial Office, USGS.
Snow Pits
There are a lot of measurements in a single snow pit. This diagram helps explain what all is measured at a snow pit.
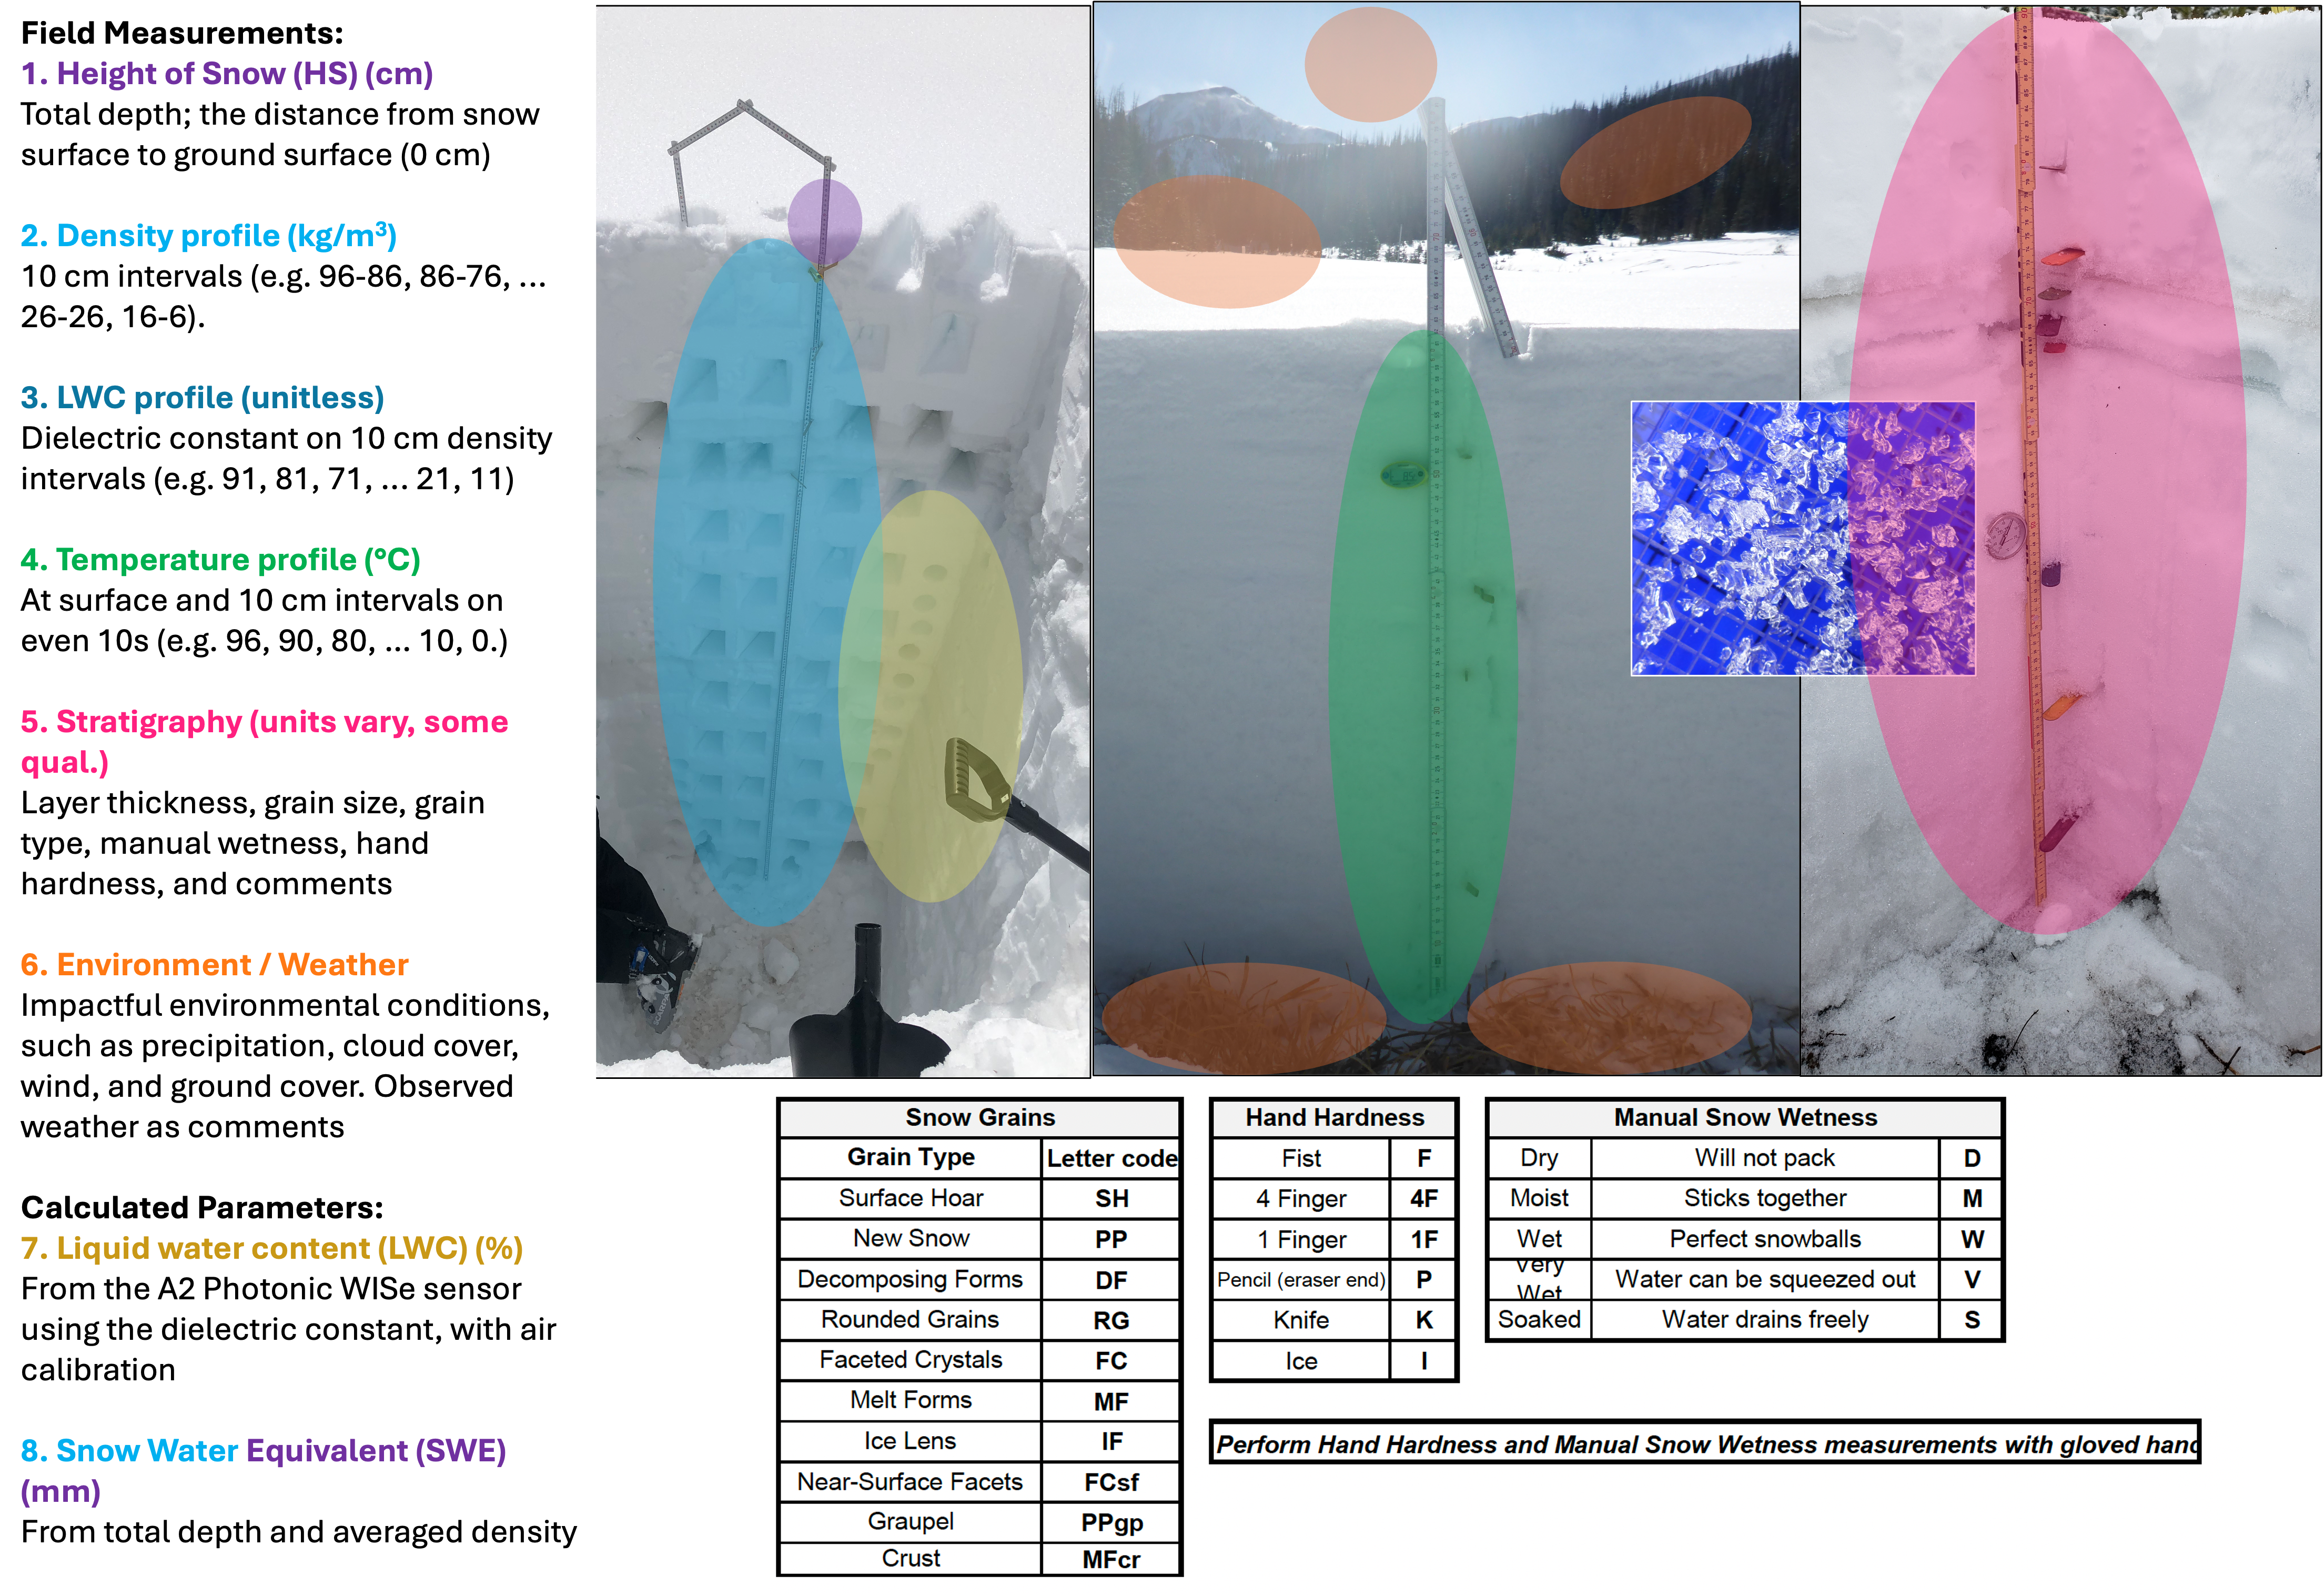 Figure 3. Description of parameters that come from a single snow pit visit. The colored ovals on the images correspond to the colored measurements on the left side.
Sampling Strategy and Naming Conventions#
I: 2020 Grand Mesa, CO IOP#
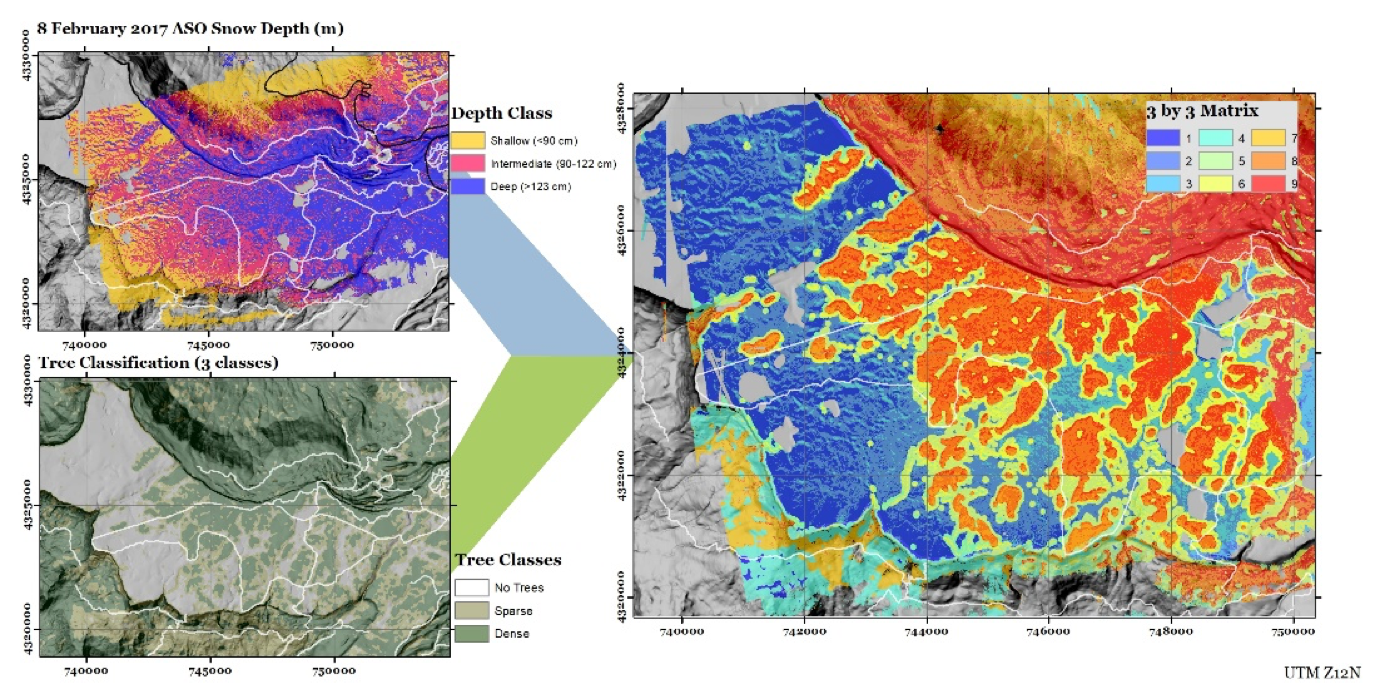 Figure 4. Nine-member snow and vegetation matrix used to sample and name snow pits during the Grand Mesa IOP campaign
Vegetation Classes
1-3 = treeless (0% tree cover)
4-6 = sparse (1-30% tree cover)
7-9 = dense (31-100% tree cover)
Snow Depth Classes
1, 4, 7 = shallow (<90cm)
2, 5, 8 = medium (90-122cm
3, 6, 9 = deep (>122cm)
Flight Lines
‘C’ = Crossline
‘N’ = North
‘S’ = South
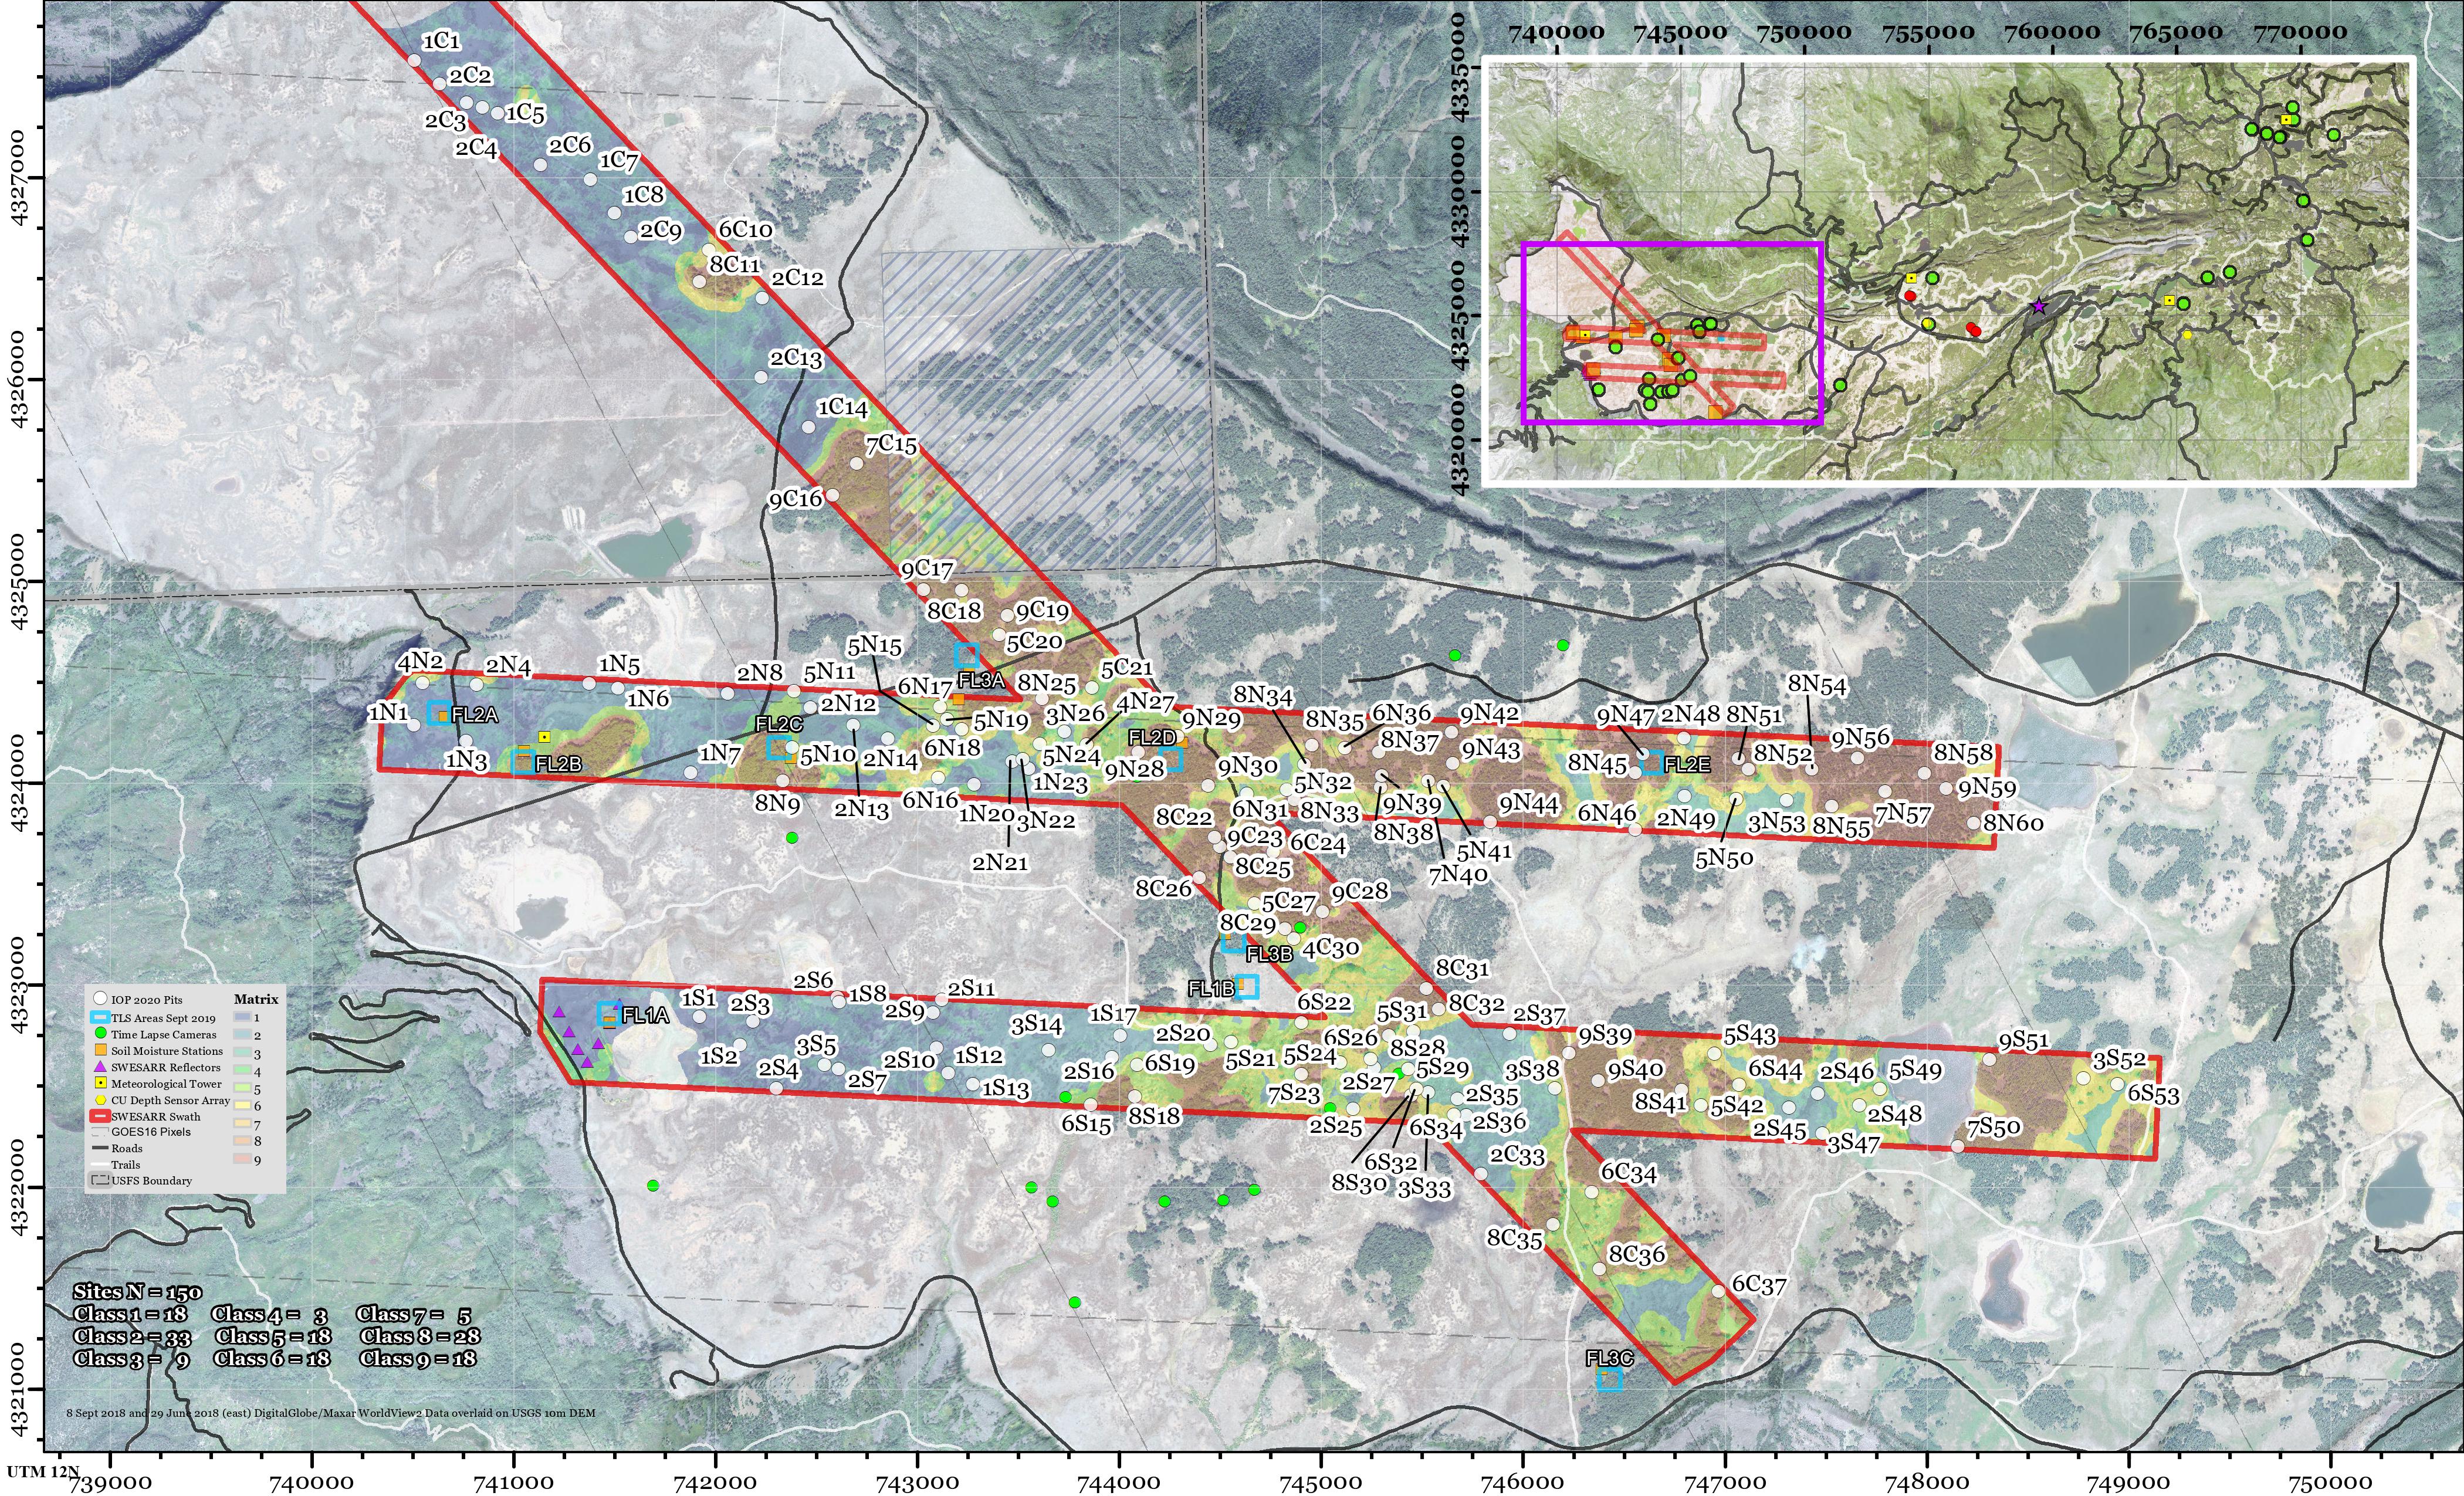
Figure 5. Grand Mesa, Colorado IOP 2020 sampling design. The rectangles are the SWESAR, UAVSAR, Thermal IR, and Gamma flight lines. The point markers are the locations of snow pits.
II: 2020/2021 Western U.S Time Series#
Location ⇨ Regional Location with existing long-term monitoring infrastructure.
Site ⇨ Averaged unique snow pit site to represent the progression of Time Series snow pits.
PitID ⇨ 6-letter code unique to all snow pit sites; 2-letter state, 2-letter Location; 2-letter site name (e.g Idaho, Boise River, Bogus Upper = IDBRBU
Unique PitID ⇨ 6-letter site code and timestamp (e.g. format: XXXXXX_yyyymmdd_hhmm, example: IDBRBU_20200116_1345)
Table 1. Comprehensive Site Summary for 2020 and 2021 Time Series Campaign
State |
Location |
Site |
PitID |
Latitude |
Longitude |
Pit Count |
Snow Class |
|---|---|---|---|---|---|---|---|
CA |
American River Basin |
Caples Lake |
CAAMCL |
38.71029 |
-120.04186 |
7 |
3 |
CA |
Mammoth Lakes |
CUES |
CAMLCP |
37.64324 |
-119.02906 |
9 |
5 |
CA |
Mammoth Lakes |
Panorama Dome |
CAMLPD |
37.61964 |
-119.00029 |
6 |
6 |
CA |
Sagehen Creek |
Forest |
CASHFO |
39.42956 |
-120.24211 |
7 |
6 |
CA |
Sagehen Creek |
Open |
CASHOP |
39.43037 |
-120.23982 |
7 |
6 |
CA |
Sagehen Creek |
Tower 4 |
CASHT4 |
39.42216 |
-120.29898 |
6 |
3 |
CO |
Cameron Pass |
Cameron Peak |
COCPCP |
40.56381 |
-105.86761 |
16 |
6 |
CO |
Cameron Pass |
Joe Wright |
COCPJW |
40.52406 |
-105.89345 |
8 |
2 |
CO |
Cameron Pass |
Michigan River |
COCPMR |
40.51864 |
-105.89193 |
22 |
2 |
CO |
East River |
Aspen |
COERAP |
38.92529 |
-106.97109 |
9 |
6 |
CO |
East River |
Forest 12 |
COER12 |
38.92973 |
-106.97824 |
12 |
2 |
CO |
East River |
Forest 13 |
COER13 |
38.92943 |
-106.97777 |
9 |
6 |
CO |
East River |
Forest 14 |
COER14 |
38.92894 |
-106.97757 |
12 |
6 |
CO |
East River |
Gothic |
COERGT |
38.95925 |
-106.99053 |
9 |
6 |
CO |
East River |
Irwin Barn |
COERIB |
38.88812 |
-107.10796 |
13 |
2 |
CO |
East River |
Open 2 |
COERO2 |
38.92661 |
-106.97848 |
9 |
2 |
CO |
East River |
Open 4 |
COERO4 |
38.92627 |
-106.97907 |
12 |
2 |
CO |
East River |
Open 6 |
COERO6 |
38.92669 |
-106.97988 |
9 |
2 |
CO |
East River |
Trench 13 |
COERTR |
38.92920 |
-106.97770 |
5 |
6 |
CO |
East River |
Upper |
COERUP |
38.93331 |
-106.98994 |
12 |
2 |
CO |
Fraser Experimental Forest |
JPL 1 |
COFEJ1 |
39.90556 |
-105.88282 |
35 |
6 |
CO |
Fraser Experimental Forest |
JPL 2 |
COFEJ2 |
39.90612 |
-105.88255 |
26 |
6 |
CO |
Fraser Experimental Forest |
SNB 1 |
COFEB1 |
39.90699 |
-105.87786 |
23 |
6 |
CO |
Fraser Experimental Forest |
SNB 2 |
COFEB2 |
39.90703 |
-105.87904 |
18 |
6 |
CO |
Grand Mesa |
County Line Open |
COGMCO |
39.03053 |
-108.03220 |
12 |
2 |
CO |
Grand Mesa |
County Line Tree |
COGMCT |
39.03223 |
-108.03438 |
10 |
2 |
CO |
Grand Mesa |
Mesa West Open |
COGMWO |
39.03399 |
-108.21390 |
10 |
2 |
CO |
Grand Mesa |
Mesa West Trees |
COGMWT |
39.03282 |
-108.21291 |
7 |
2 |
CO |
Grand Mesa |
Skyway Open |
COGMSO |
39.04511 |
-108.06209 |
21 |
2 |
CO |
Grand Mesa |
Skyway Tree |
COGMST |
39.04565 |
-108.06333 |
18 |
2 |
CO |
Niwot Ridge |
C1 |
CONWC1 |
40.03317 |
-105.54616 |
9 |
6 |
CO |
Niwot Ridge |
Forest Flat |
CONWFF |
40.03186 |
-105.54667 |
12 |
6 |
CO |
Niwot Ridge |
Forest North |
CONWFN |
40.03337 |
-105.55380 |
11 |
2 |
CO |
Niwot Ridge |
Forest South |
CONWFS |
40.04021 |
-105.55701 |
13 |
2 |
CO |
Niwot Ridge |
Open Flat |
CONWOF |
40.03579 |
-105.55205 |
15 |
6 |
CO |
Niwot Ridge |
Saddle |
CONWSA |
40.05497 |
-105.59065 |
7 |
1 |
CO |
Senator Beck |
Senator Beck |
COSBSB |
37.90705 |
-107.72626 |
5 |
1 |
CO |
Senator Beck |
Swamp Angel |
COSBSA |
37.90714 |
-107.71121 |
19 |
2 |
ID |
Boise River Basin |
Banner Open |
IDBRBO |
44.30456 |
-115.23601 |
11 |
6 |
ID |
Boise River Basin |
Banner Snotel |
IDBRBS |
44.30362 |
-115.23457 |
23 |
6 |
ID |
Boise River Basin |
Bogus Lower |
IDBRBL |
43.76434 |
-116.10660 |
17 |
6 |
ID |
Boise River Basin |
Bogus Lower Trees |
IDBRBT |
43.76057 |
-116.08979 |
13 |
6 |
ID |
Boise River Basin |
Bogus Upper |
IDBRBU |
43.75881 |
-116.09019 |
11 |
6 |
ID |
Boise River Basin |
LDP Open |
IDBRLO |
43.73707 |
-116.12179 |
19 |
6 |
ID |
Boise River Basin |
LDP Tree |
IDBRLT |
43.73634 |
-116.12053 |
17 |
6 |
ID |
Boise River Basin |
Mores Creek Summit |
IDBRMC |
43.94735 |
-115.67666 |
3 |
6 |
MT |
Central Ag Research Center |
SnowEx-1 |
MTCASX |
47.05836 |
-109.95688 |
4 |
5 |
MT |
Central Ag Research Center |
Wheat |
MTCAWH |
47.05942 |
-109.95176 |
1 |
5 |
MT |
Central Ag Research Center |
Wx |
MTCAWX |
47.06062 |
-109.95693 |
4 |
5 |
NM |
Jemez River |
BA Flux Tower |
NMJRBA |
35.88859 |
-106.53184 |
8 |
5 |
NM |
Jemez River |
HQ Met Station |
NMJRHQ |
35.85791 |
-106.52137 |
8 |
5 |
UT |
Little Cottonwood Canyon |
Alta Collins |
UTLCAC |
40.57210 |
-111.62997 |
17 |
2 |
UT |
Little Cottonwood Canyon |
Atwater |
UTLCAW |
40.59125 |
-111.63759 |
20 |
5 |
Note - If a site was repeated (e.g. Cameron Pass, Michigan River) then the Pit Count column is the sum of the observations for two years). The Snow Class column was extracted from the 300 m Snow Classification data set (Liston, 2021 and can be accessed here at NSIDC). See the previous notebook to characterize the Snow Classes.
This table can be accessed as a geojson from Megan’s github gists
To use this as a geojson in your project:
Navigate to the link above
Check out the map of data (zoom in, zoom out, etc.)
Select the ‘Raw’ button from the top right corner
Copy/Paste the URL (it’s longer now)
Use the code block below to import
import geopandas as gpd
import requests
url = "https://gist.githubusercontent.com/meganmason/dde13c46a90875e364b1c25a31bff1d8/raw/d361e1a56eeb867bd89c87b4dc13ed431ffff6f6/SNEX_TS_SP_avg_prelim_Hackweek.geojson"
gdf = gpd.read_file(url)
gdf.head()
| State | Location | Site | PitID | Latitude | Longitude | Pit Count | Snow Class | geometry | |
|---|---|---|---|---|---|---|---|---|---|
| 0 | CA | American River Basin | Caples Lake | CAAMCL | 38.71029 | -120.04186 | 7 | 3 | POINT (-120.04186 38.71029) |
| 1 | CA | Mammoth Lakes | CUES | CAMLCP | 37.64324 | -119.02906 | 9 | 5 | POINT (-119.02906 37.64324) |
| 2 | CA | Mammoth Lakes | Panorama Dome | CAMLPD | 37.61964 | -119.00029 | 6 | 6 | POINT (-119.00029 37.61964) |
| 3 | CA | Sagehen Creek | Forest | CASHFO | 39.42956 | -120.24211 | 7 | 6 | POINT (-120.24211 39.42956) |
| 4 | CA | Sagehen Creek | Open | CASHOP | 39.43037 | -120.23982 | 7 | 6 | POINT (-120.23982 39.43037) |
III: Arctic Tundra and Boreal Forest, Alaska IOP#
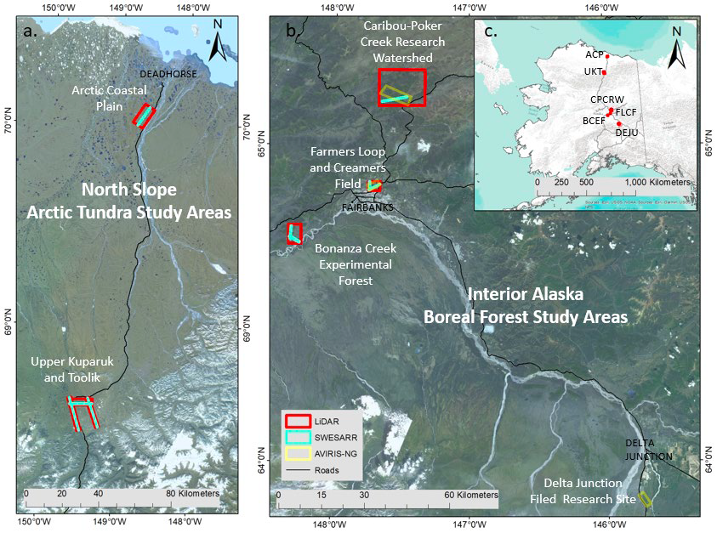
Figure 6. SnowEx 2023 site locations in Interior Alaska (boreal forest) and on the North Slope (tundra) of Alaska. The flight lines for SWESARR (turquoise areas) and lidar/stereo (red boxes). SWE/snow depth measurement periods studied five locations: three in the boreal forest and two in the arctic tundra. The albedo/snow melt campaign period studied three sites in the boreal forest.
SWE/snow depth focused campaign (Oct 2022, March 2023, Oct 2023)#
Fairbanks area / Interior Alaska –> Boreal Forest
FLCF - Farmer’s Loop and Creamer’s Field (001-108)
CPCRW - Caribou-Poker Creek Research Watershed (200-283)
BCEF - Bonanza Creek Experimental Forest (300-482)
Vegetation Classes: (National Land Cover Dataset) D - Deciduous, E - Evergreen, S - Shrub, W - Wetland, C - Crop
Snow Depth Classes: B - Below Average, N - Average (neutral), A - Above Average
North Slope Alaska –> Arctic Tundra
UKT - Upper Kuparuk-Toolik (500-566)
ACP - Alaska Coastal Plain (600-800)
Vegetation Classes (Not used for Tundra sites)
Snow Depth Classes (SnowModel terrain, land cover, and snow depth output)
N - Neutral (windward), A - Above Neutral (leeward), D - Snow Drift, I - Ice Cover (lake/river) - only visited March 2023
Flight Lines
FLCF (2): North, SW
BCEF (3): NE, SW, North
CPCRW (1): East
UKT (3): North, East, South
ACP (1): NNE
Albedo/snow melt focused campaign (Apr/May 2023)#
Interior Alaska –> Boreal Forest
FLCF - Farmer’s Loop and Creamer’s Field
CPCRW - Caribou-Poker Creek Research Watershed
DEJU - Delta Junction Research Area
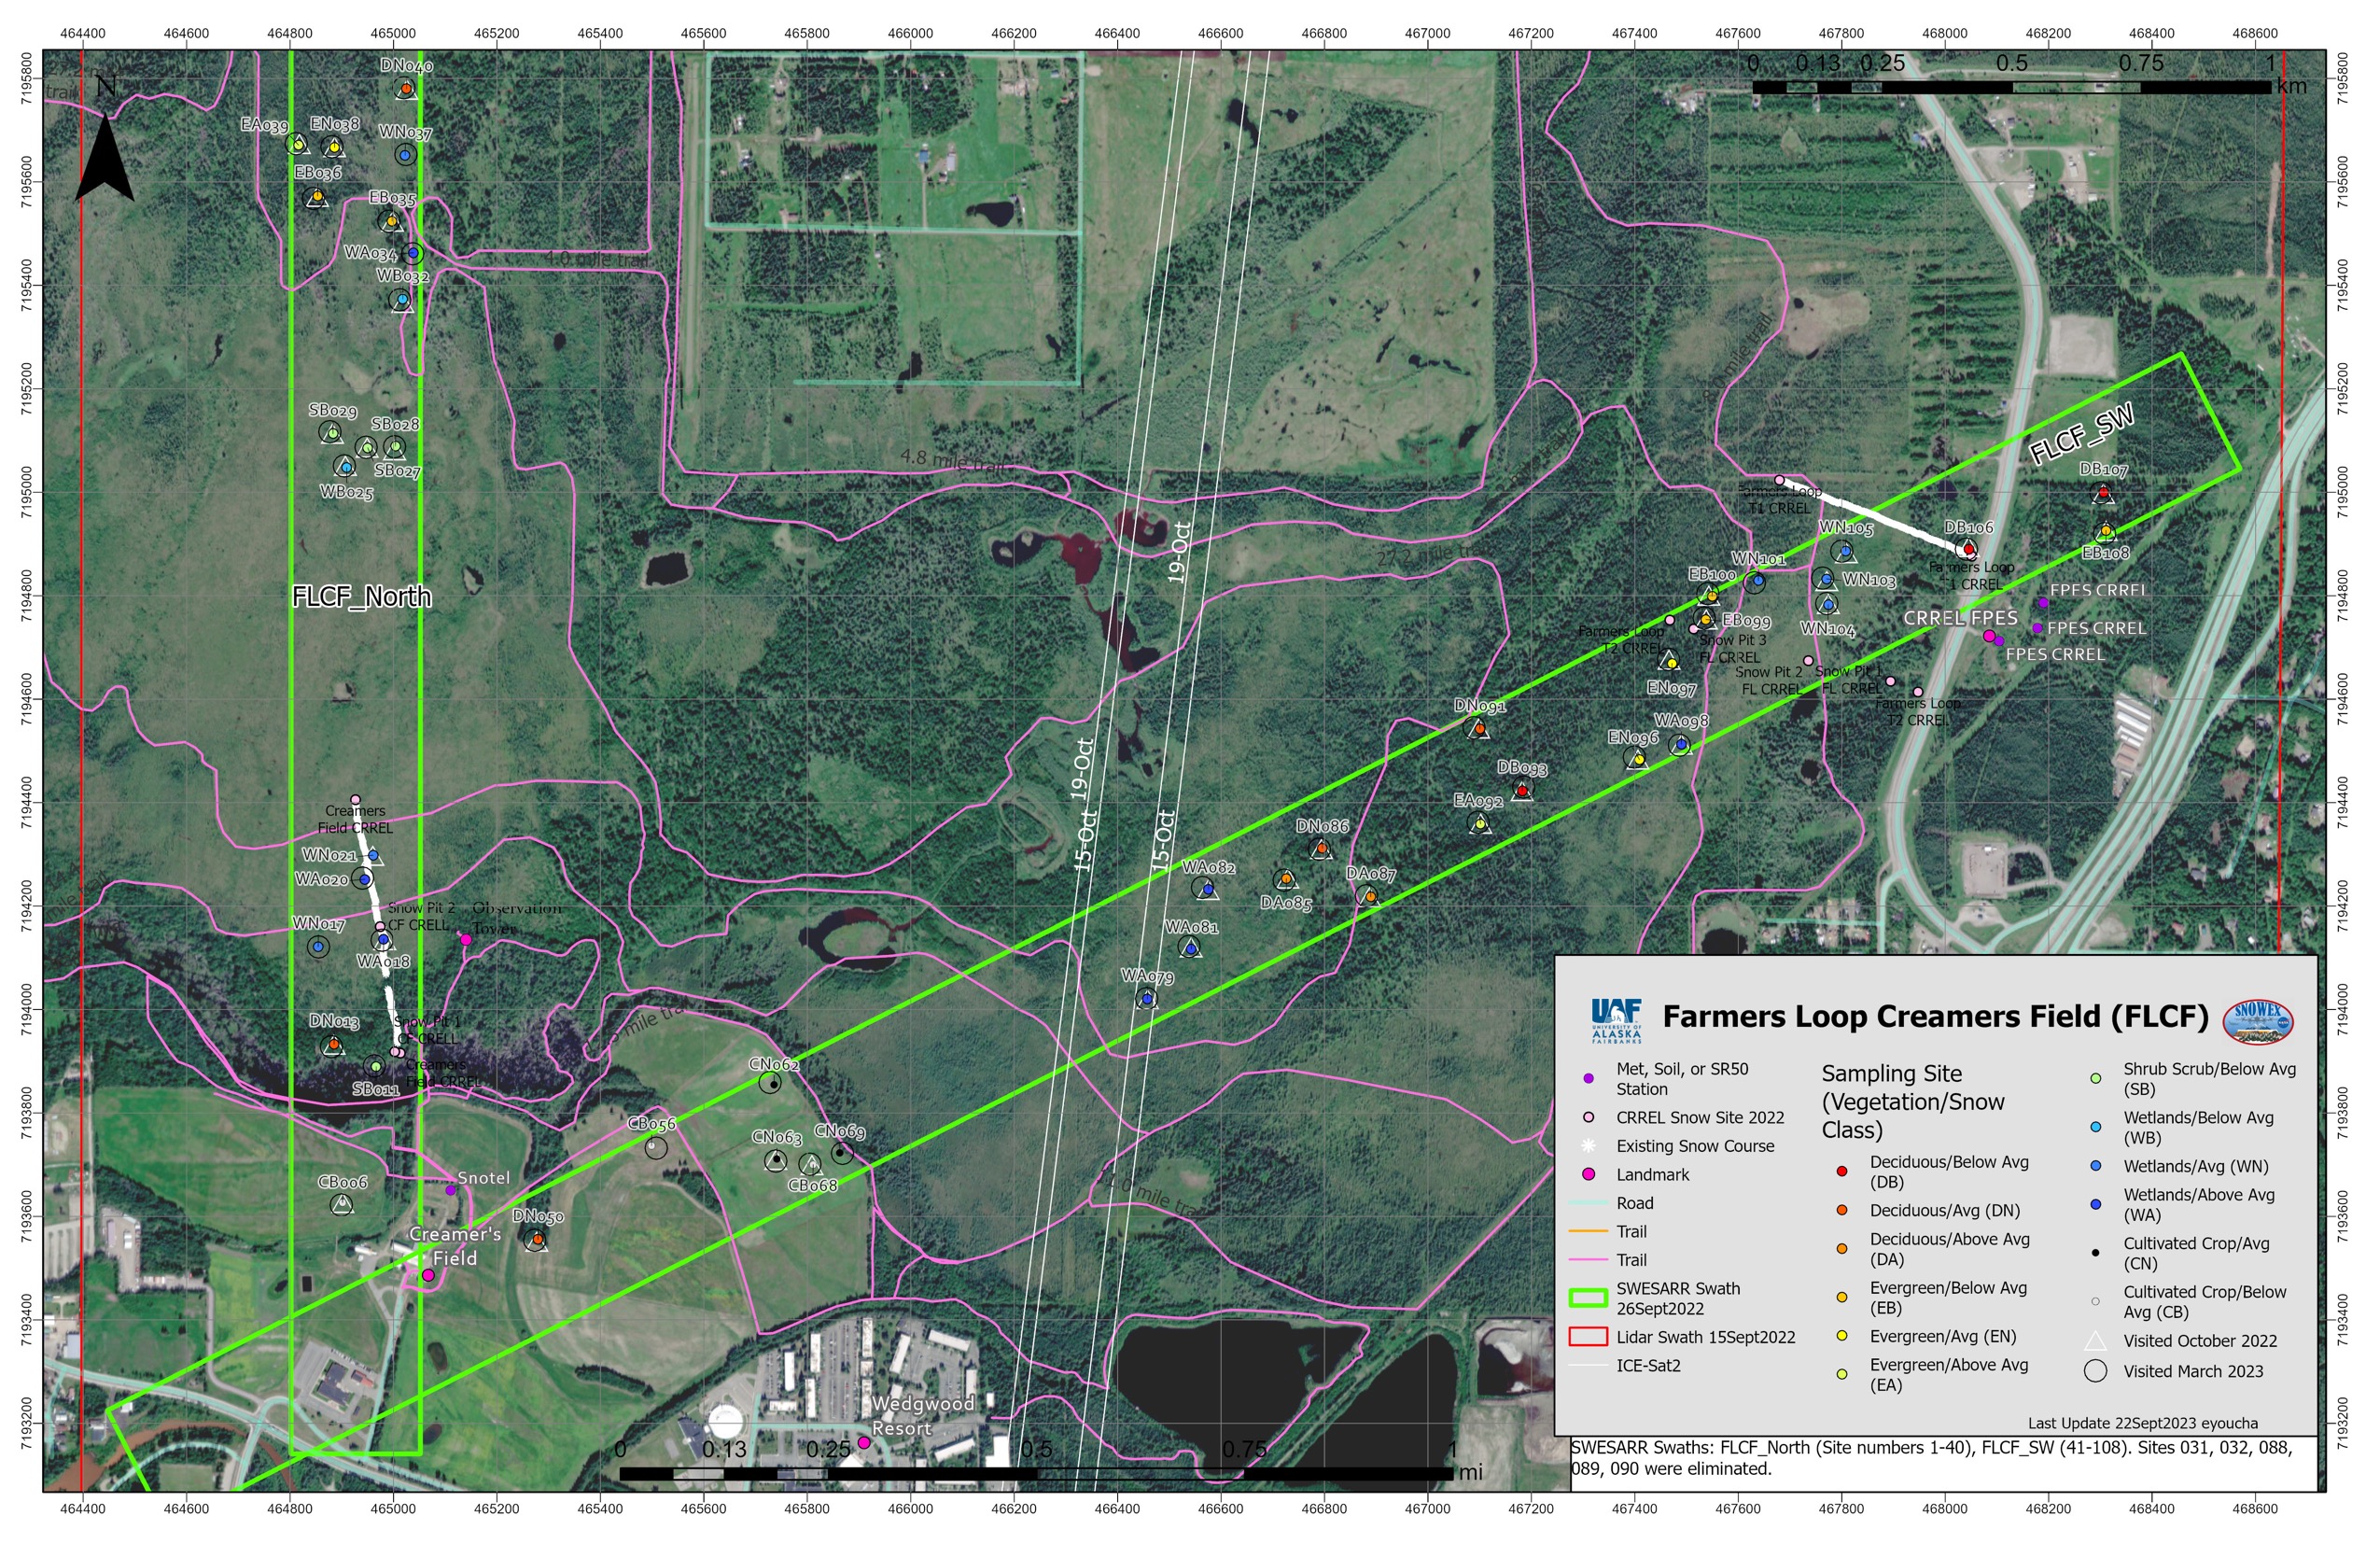 Figure 7. Farmers Loop Creamers Field (FLCF) field site (one of five SWE/depth focused study sites for the Alaska IOP). Snow pit study plots (colored points) distributed within the SWESARR flight swaths (green rectangle) and lidar flight box (red line). Pit sites are marked with October 2022 (white triangle) and March 2023 (black circle) site visits.
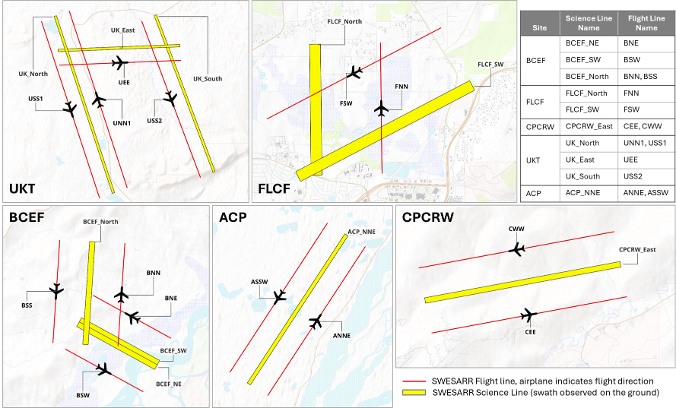
Figure 8. SWESARR science lines (yellow boxes) and associated flight lines (red line) over each site.

Figure 9. Represenative land cover classes for the boreal forests taken from the Southeast corner of the 5x5 m study plot.
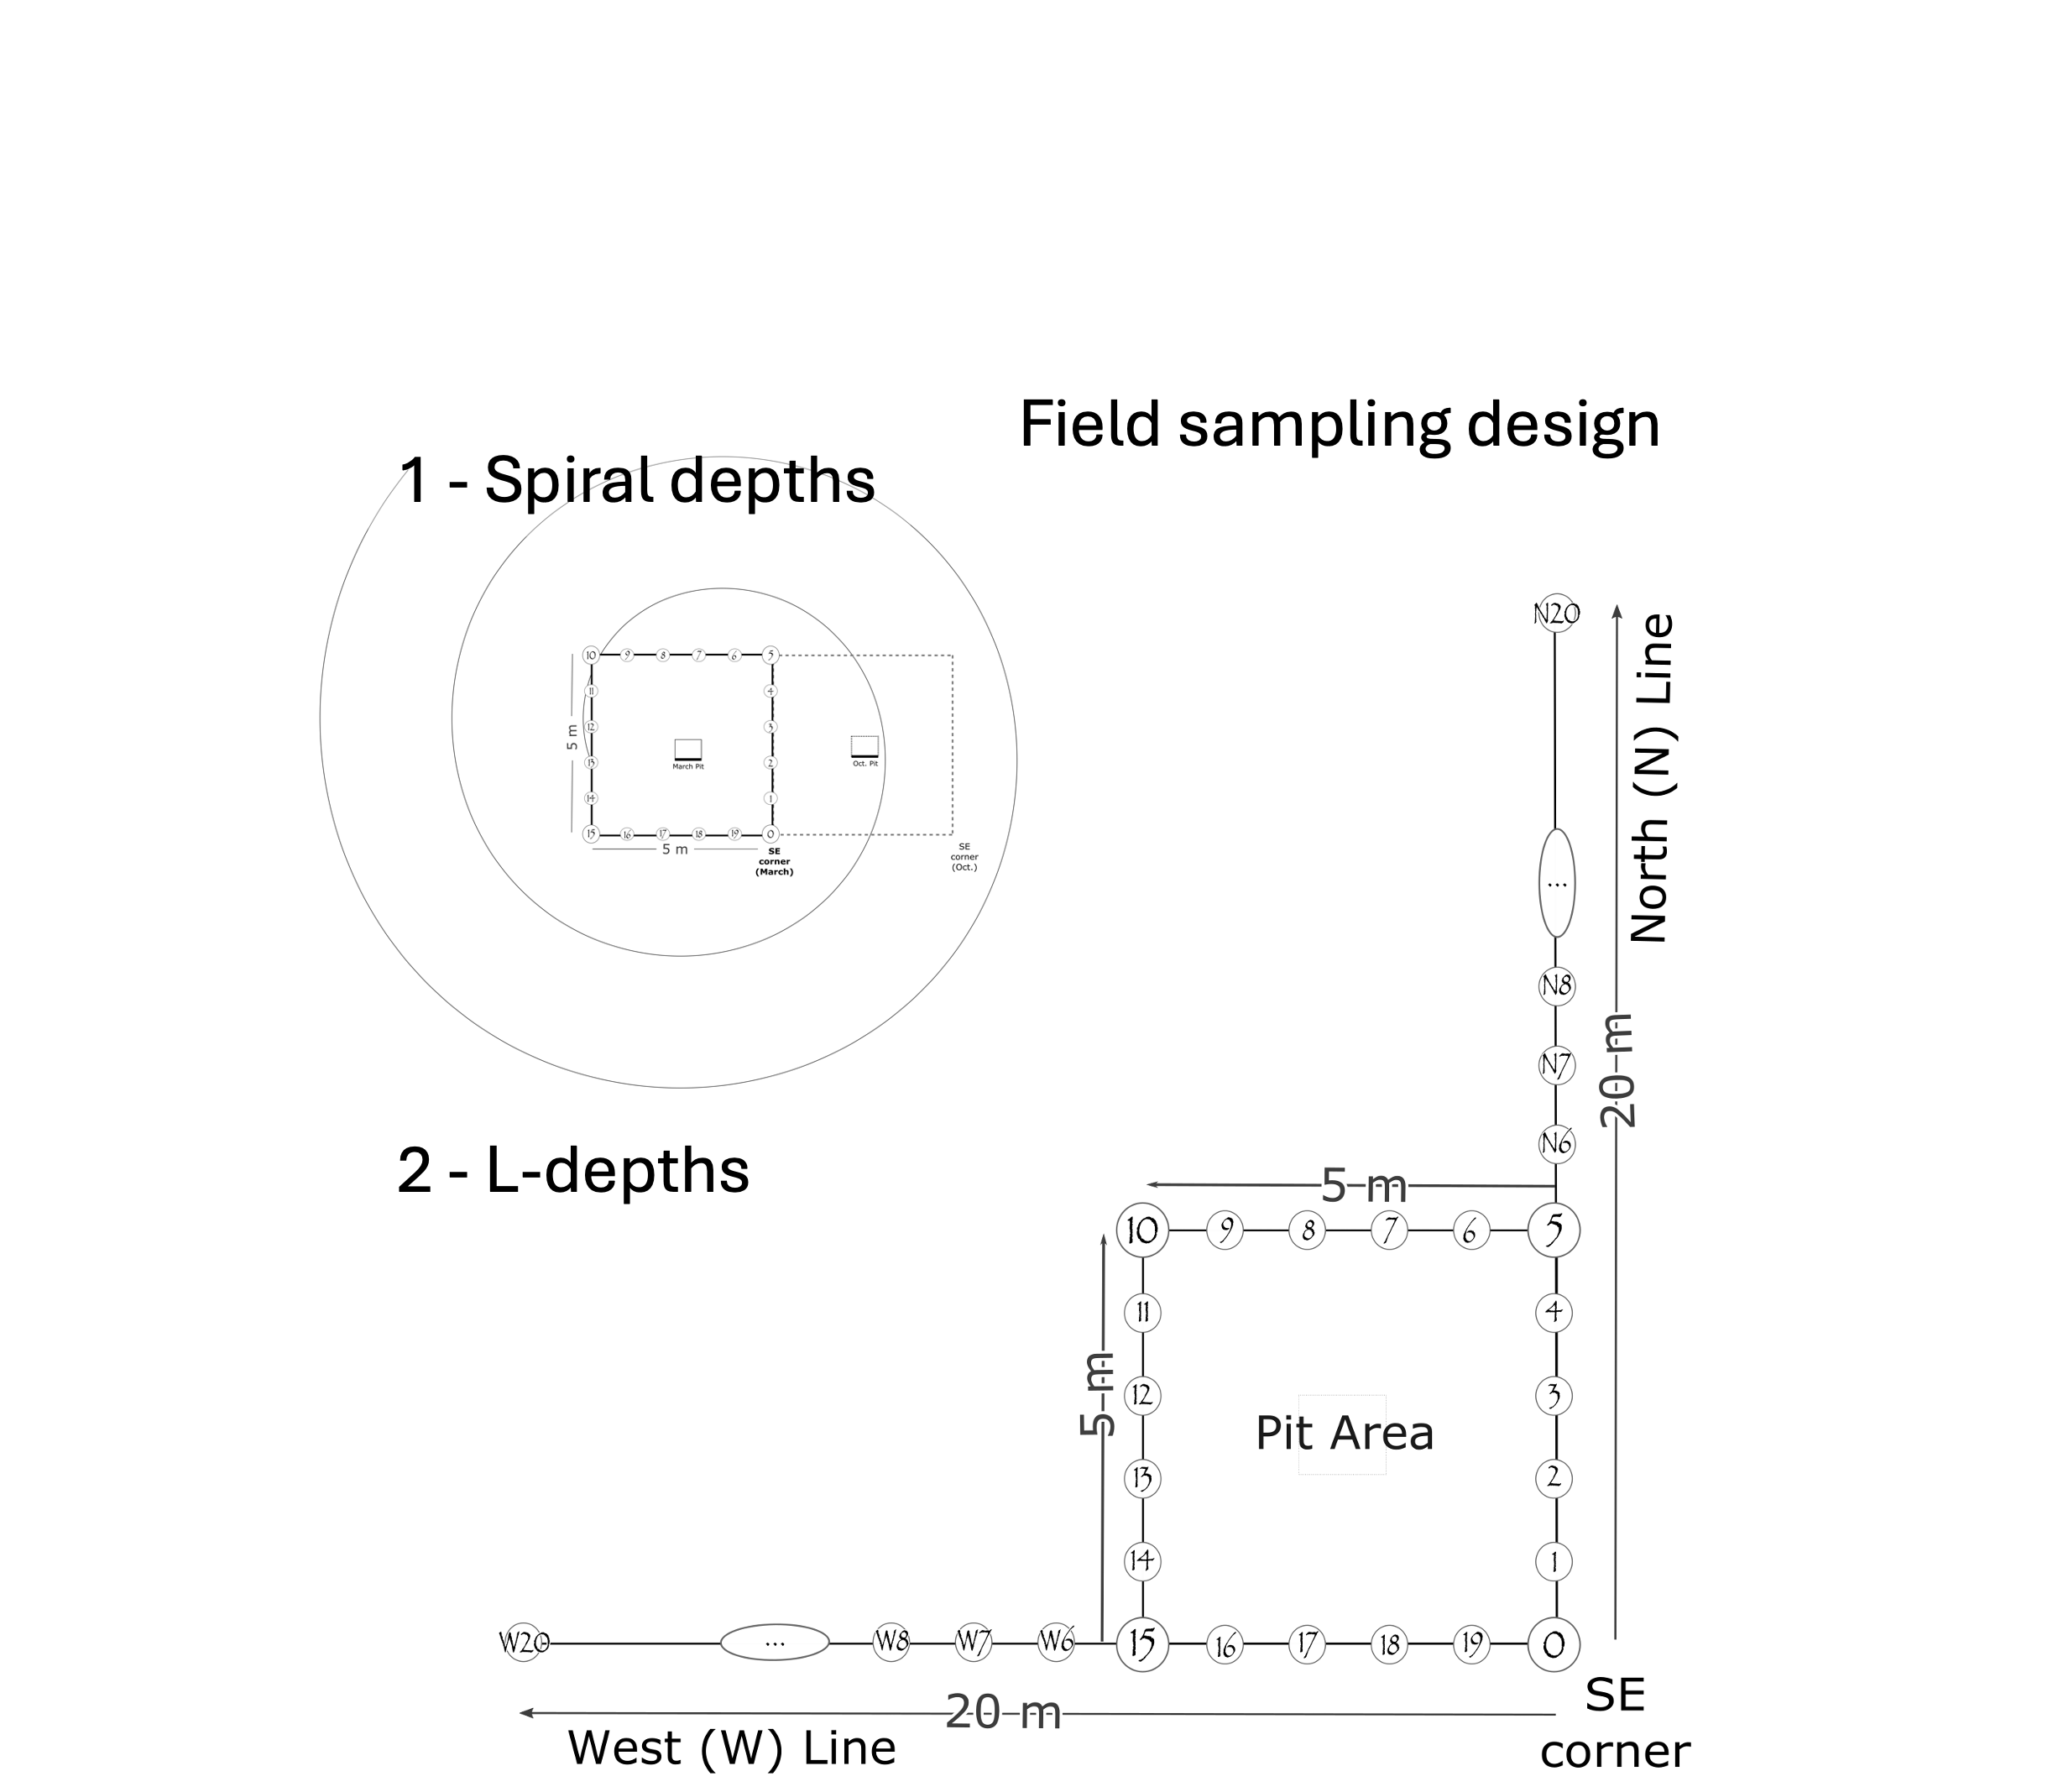
Figure 10. The study plot sampling design for the SWE/snow depth focused campaign. Field crews marked the Southeast corner and measured square-depths around the 5x5 m perimeter on a 1m interval. Snow depths were collected on a north and west transect of 20 m (15 m addition to the study plot perimeter) or a spiral pattern was used depending on depth instrument availability. The snow pit was excavated in the center of the study plot. SSA measurements were collected inside the ~1x1 m snow pit. SMP measurments were taken at the front of the snow pit and up to 50 m from the snow pit.
Where can I find data?#

1. SnowEx data sets are stored and archived at the National Snow and Ice Data Center (NSIDC) in Boulder, Colorado.#
Table 2. Summary of Core Data Sets with DOI links for applicable data sets
Core Data Sets |
Parameters Available |
Instruments |
NSIDC Access |
|---|---|---|---|
Snow Pits |
Depth, Density, Temp., LWC, Stratigraphy, Grain Size, Wetness, Hand Hardness, Qualitative Environment, SWE |
Standard pit kit |
SNEX17_SP_GMIOP |
Depth Transects |
Snow Depth - various sampling designs |
MagnaProbe, Mesa2/Geode, Pit Ruler |
SNEX17_SD |
Interval Boards/ SWE Tubes |
New (or total) snow, SWE, density |
Tube, ruler and scale |
SNEX20_ST_GMIOP |
SSA |
Snow reflectance, Specific surface area |
IceCube, IRIS, InfraSnow |
SNEX17_SSA_GMIOP |
SMP |
Depth, Force (snow microstructure) |
SnowMicroPen |
SNEX17_SMP_GMIOP |
Visit NSIDC’s SnowEx Overview page to see a full table of all available 2017, 2020, 2021 and 2023 products.
2. SnowEx SQL Database (preview in next tutorial!)#
Recap#
You know which measurements we have a LOT of and are consistent between multiple field campaigns
You are aware of the basic sampling strategy for the various campaigns
You have a few tools at your finger tips to access and learn more about the data

